Splunk Query Examples: 15 SPL Searches Every SOC Analyst Needs (2026)
15 essential Splunk query examples for SOC analysts — failed logins, threat hunting, correlation, and incident investigation with real SPL you can run today.
EpicDetect Team
12 min read
Splunk Query Examples: 15 SPL Searches Every SOC Analyst Needs (2026)
You're staring at Splunk. Again.
You know you need to hunt for suspicious activity, investigate that weird alert, or pull logs for an incident report. But you can't quite remember the exact SPL syntax — so you Google it. Again.
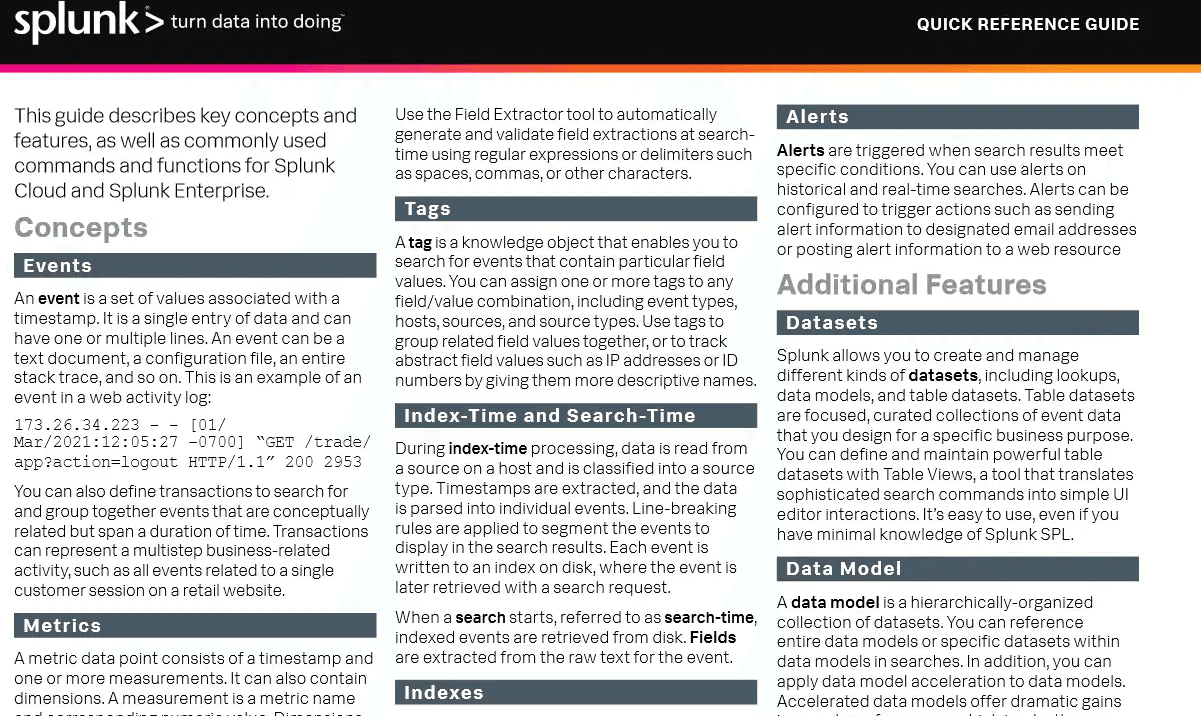
If you searched for splunk query examples, you're in the right place. These 15 SPL searches cover the patterns that show up in roughly 80% of Tier 1 and Tier 2 SOC work. Bookmark the free SPL cheatsheet, then run guided versions in the Introduction to SPL pathway.
Why Do These Splunk Query Examples Matter?
Splunk Search Processing Language (SPL) is how you actually use Splunk. It's how you find the needle in the haystack of millions of logs.
What you'll use SPL for:
- Investigating security alerts
- Threat hunting for suspicious patterns
- Creating detection rules
- Generating reports for incidents
- Baseline analysis and anomaly detection
The faster you can write queries, the faster you can respond to threats. These 15 queries are your foundation — and each one includes the investigation context where it actually shows up on shift.
Want to run this kind of correlation inside an actual unfolding incident instead of against sample data? Adventures is a free story-driven investigation where SIEM queries are how you crack the case.
---
Query 1: Basic Search with Time Range
What it does: Search for specific events within a time window
index=main sourcetype=windows:security EventCode=4625
earliest=-24h latest=now
Investigation context: This is your first move on almost every alert. A suspicious login ticket lands at 2:14 PM — you immediately constrain to the alert window plus a buffer (usually 24h back) so you're not drowning in unrelated noise.
When to use it:
- Starting point for most investigations
- Limiting results to relevant timeframe
- Reducing search load on Splunk
Real scenario: "Show me all failed login attempts in the last 24 hours"
Tips:
- Always specify index and sourcetype (faster searches)
- Use earliest and latest to narrow timeframe
- Common time modifiers: -1h, -24h, -7d, -30d
---
Query 2: Count Events by Field
What it does: Aggregate and count occurrences of a field
index=security sourcetype=firewall action=blocked
| stats count by src_ip
| sort - count
Investigation context: After a brute-force alert fires, you need to know who is hitting you hardest. This query answers "is this one IP or a distributed spray?" in seconds — and the sort tells you where to focus first.
When to use it:
- Finding the most active IPs, users, or hosts
- Identifying potential scanning or brute force activity
- Baseline establishment
Real scenario: "Which IPs are getting blocked by the firewall most?"
Tips:
- stats count by [field] is your friend
- sort - count shows highest counts first (descending)
- Can count by multiple fields: stats count by src_ip, dest_port
---
Query 3: Search with Wildcards
What it does: Pattern matching with wildcards
index=web sourcetype=access_combined
| search user_agent="bot" OR user_agent="crawler"
Investigation context: Web application alerts often involve scanner traffic mixed with legitimate crawlers. Wildcards let you cast a wide net during initial triage before you tighten the search with regex or known-bad signatures.
When to use it:
- Partial string matching
- Finding variations of the same thing
- Broad initial searches
Real scenario: "Find all web requests from bots or crawlers"
Tips:
- * matches any number of characters
- Use quotes for multi-word patterns
- Wildcards at the beginning slow searches (avoid "*admin" if possible)
---
Query 4: Filter with WHERE
What it does: Filter results based on conditions
index=authentication sourcetype=radius
| stats count by username
| where count > 10
Investigation context: Your SIEM flagged "unusual authentication volume" but the raw results are thousands of rows. where lets you apply a threshold after aggregation — the classic "show me users who failed more than 10 times" brute-force filter.
When to use it:
- Filtering aggregated results
- Finding anomalies based on thresholds
- Post-processing after stats/calculations
Real scenario: "Show users who authenticated more than 10 times"
Tips:
- where comes after aggregation (stats, timechart, etc.)
- Can use comparison operators: >, <, >=, <=, !=, =
- Combine conditions: where count > 10 AND count < 100
---
Query 5: Field Extraction with REX
What it does: Extract fields from raw logs using regex
index=web sourcetype=apache
| rex field=_raw "status=(?\d+)"
| stats count by http_status
Investigation context: Custom application logs often arrive without parsed fields. During a web attack investigation, you may need to pull status codes, session IDs, or error strings out of _raw because nobody configured the sourcetype properly (happens constantly).
When to use it:
- When Splunk doesn't auto-extract fields
- Custom parsing of log formats
- Extracting specific patterns from text
Real scenario: "Extract HTTP status codes from custom web logs"
Tips:
- Named capture groups: (?
- Test regex patterns before using in production
- Use rex mode=sed for string replacement
---
Query 6: Dedup (Remove Duplicates)
What it does: Remove duplicate events based on field values
index=security EventCode=4624
| dedup username
| table _time, username, src_ip
Investigation context: When building a user activity timeline, you often need "first login from this IP" not every single 4624 event. Dedup keeps your report readable and stops you from double-counting the same session.
When to use it:
- Getting unique values
- Cleaning up repetitive results
- First/last occurrence analysis
Real scenario: "Show me unique users who logged in (one entry per user)"
Tips:
- dedup [field] keeps first occurrence by default
- dedup username sortby -_time keeps most recent
- Can dedup by multiple fields: dedup username, src_ip
---
Query 7: Timechart for Time-Series Analysis
What it does: Create time-based aggregations
index=security EventCode=4625
| timechart span=1h count by username
Investigation context: Spikes tell stories. A credential stuffing attack shows up as a sudden wall of failed logins in one hour bucket. Timechart is how you prove (or disprove) that the alert timing matches an actual anomaly.
When to use it:
- Visualizing trends over time
- Identifying spikes or anomalies
- Creating dashboards
Real scenario: "Show failed logins per hour for each user"
Tips:
- span=1h sets time buckets (1m, 5m, 1h, 1d, etc.)
- Great for charts and visualizations
- Limit results: timechart span=1h count by username limit=10
---
Query 8: Eval (Create Calculated Fields)
What it does: Create new fields or modify existing ones
index=security EventCode=4625
| eval failed_login_time=strftime(_time, "%Y-%m-%d %H:%M:%S")
| eval status=if(Account_Name="admin", "CRITICAL", "normal")
| table failed_login_time, Account_Name, status
Investigation context: During escalation, you need human-readable timestamps and severity flags. Eval lets you tag privileged account failures as CRITICAL without writing a separate search — useful when you're building a quick incident summary for Tier 2.
When to use it:
- Formatting fields
- Conditional logic
- Math calculations
Real scenario: "Flag admin login failures as critical"
Tips:
- if(condition, true_value, false_value) for conditionals
- case() for multiple conditions
- Math: eval total=value1 + value2
---
Query 9: Join Data from Multiple Indexes
What it does: Combine results from different searches
index=firewall action=blocked
| stats count by src_ip
| join src_ip
    [search index=threat_intel | table src_ip, threat_score]
| where threat_score > 50
Investigation context: Firewall blocks alone aren't enough — you need context. Joining blocked IPs against a threat intel index answers "is this just noise or a known bad actor?" during active triage.
When to use it:
- Correlating data from different sources
- Enriching events with additional context
- Threat intelligence lookups
Real scenario: "Find blocked IPs that match threat intel feeds"
Tips:
- Use join sparingly (can be slow on large datasets)
- Consider lookup for static reference data
- Subsearches go in [ ] brackets
---
Query 10: Transaction (Group Related Events)
What it does: Group events that are related into transactions
index=web sourcetype=access_combined
| transaction session_id maxpause=30m
| where duration > 3600
| table session_id, duration, eventcount
Investigation context: Attackers don't operate in single events — they move through a session. Transaction groups related web requests so you can spot abnormally long sessions or multi-step exploitation chains that individual log lines hide.
When to use it:
- Tracking user sessions
- Analyzing multi-step processes
- Finding long-running activities
Real scenario: "Find web sessions lasting over 1 hour"
Tips:
- maxpause defines max time between events in transaction
- duration field automatically created (in seconds)
- eventcount shows number of events in transaction
---
Query 11: Subsearch (Search Within a Search)
What it does: Use results from one search as input to another
index=authentication action=failure
    [search index=threat_intel category=malicious | fields src_ip]
| stats count by username, src_ip
Investigation context: Dynamic filtering is core to threat hunting. Instead of hardcoding bad IPs, you pull them from your intel index and let the subsearch drive the main query — exactly how you'd hunt "logins from known-malicious sources."
When to use it:
- Dynamic filtering based on search results
- Correlating across indexes
- Complex threat hunting
Real scenario: "Find login failures from IPs in threat intel database"
Tips:
- Subsearches run first, then pass results to main search
- Limit subsearch results (max 50k events by default)
- Can be resource-intensive
---
Query 12: Top Command (Quick Stats)
What it does: Show most/least common values for a field
index=dns
| top limit=20 query
Investigation context: DNS exfiltration and C2 often hide in "weird but not obviously malicious" queries. Running top on DNS query fields during an investigation quickly surfaces domains that shouldn't be there.
When to use it:
- Quick frequency analysis
- Finding outliers
- Dashboard building
Real scenario: "What are the top 20 DNS queries?"
Tips:
- top shows most common by default
- rare shows least common
- Add showperc=true to show percentages
- limit=X controls number of results
---
Query 13: Lookup (Enrich with Reference Data)
What it does: Add fields from lookup tables
index=firewall
| lookup geo_ip_lookup ip as src_ip OUTPUT country, city
| stats count by country
Investigation context: "Login from Russia" means nothing if you don't know the user's normal geography. Lookups add country, asset owner, or department context so you can decide escalate vs. close in minutes instead of hours.
When to use it:
- GeoIP lookups
- Asset inventory enrichment
- Threat intelligence matching
- User/host information
Real scenario: "Show firewall blocks by country"
Tips:
- Faster than joins for static reference data
- Create lookup files via CSV upload
- Automatic lookups can be configured in Splunk
---
Query 14: Regex (Advanced Filtering)
What it does: Use regular expressions for complex pattern matching
index=web sourcetype=access_combined
| regex user_agent="(?i)(nikto|sqlmap|nmap|metasploit)"
Investigation context: Web attack alerts often involve scanner user-agents or encoded payloads that wildcards miss. Regex catches tool signatures during triage — especially when you're validating whether an "anomalous web traffic" alert is a real probe.
When to use it:
- Complex pattern matching beyond wildcards
- Case-insensitive searches
- Multi-pattern detection
Real scenario: "Find web requests from known hacking tools"
Tips:
- (?i) makes regex case-insensitive
- Test patterns at regex101.com first
- Can be slower than simple searches
---
Query 15: Streamstats (Running Calculations)
What it does: Calculate running totals or moving averages
index=authentication action=success
| streamstats count by username reset_on_change=true
| where count > 5
Investigation context: Password spraying looks like low-and-slow success across many accounts — not a burst. Streamstats detects rapid successive events per user, which is how you catch "5 logins in 30 seconds" patterns that a simple count misses.
When to use it:
- Detecting rapid successive events
- Baseline comparison
- Identifying suspicious patterns
Real scenario: "Find users with 5+ rapid successive logins"
Tips:
- streamstats maintains order (unlike stats)
- reset_on_change=true resets count when field value changes
- Good for time-based anomaly detection
---
Pro Tips for Writing Better SPL
Now that you've got 15 essential queries, here are some tips to level up your SPL game. If you're new to Splunk, these 5 Splunk mistakes trip up almost everyone — avoid them early.
1. Index and Sourcetype First
Always start with index= and sourcetype= to make searches faster.
Slow:
EventCode=4625
Fast:
index=windows sourcetype=windows:security EventCode=4625
2. Use Fields Command to Reduce Data
Only keep fields you need to speed up searches.
index=web | fields src_ip, url, status
3. Avoid Leading Wildcards
Searches starting with * are slow. Be specific.
4. Use Head to Limit Results During Testing
When building queries, limit results to test faster.
index=firewall | head 100
5. Pipe Efficiency Matters
Put filtering commands early in the pipeline.
---
Common SOC Use Cases
Here's how these queries apply to real SOC work:
Failed Login Investigation
index=authentication action=failure
| stats count by username, src_ip
| where count > 5
| sort - count
Suspicious PowerShell Execution
index=windows EventCode=4688
| search CommandLine="powershell" AND CommandLine="-enc"
| table _time, ComputerName, User, CommandLine
Outbound Traffic to Rare Destinations
index=firewall action=allowed direction=outbound
| stats count by dest_ip
| where count < 5
---
Practice Makes Perfect
Reading SPL is one thing. Writing it from muscle memory during an active investigation is another.
How to actually get good at SPL:
1. Practice daily – Even 15 minutes writing queries
2. Start simple – Master basic searches before advanced stuff
3. Use the cheatsheet – Free SPL cheatsheet plus the Introduction to SPL pathway
4. Do hands-on labs – SIEM practice for beginners with realistic datasets beats copy-pasting examples
The SOC analysts who are fastest at investigating incidents? They're not Googling SPL syntax — they've got these patterns memorized.
---
TL;DR – 15 Splunk Query Examples to Bookmark
These 15 SPL searches cover 80% of daily SOC work: time-bounded searches, stats aggregation, wildcards, where filters, rex extraction, dedup, timechart, eval, joins, transactions, subsearches, top/rare, lookups, regex, and streamstats. Each one maps to a real investigation step — triage, enrichment, correlation, or escalation. Bookmark the SPL cheatsheet and practice in context, not in isolation.
---
FAQs
Do I need to memorize all of these?
Not necessarily, but the first 10 show up constantly. Bookmark this page and the SPL cheatsheet until they become second nature.
What if my logs don't have the fields in these examples?
Adjust field names to match your environment. The query patterns stay the same — just swap out the field names.
Is Splunk the only SIEM I should learn?
Nope, but it's one of the most common. The concepts transfer to Sentinel (KQL) and Elastic. Learn SPL first, then others become easier.
Can I use these queries in Splunk Free?
Yep. These all work in Splunk Free. Limitations are around alerting and clustering, not search functionality.
---
Sources & References:
---
Final thought: Copy these 15 queries into a text file or OneNote. Next time you're in Splunk and can't remember the syntax, you'll have it ready. Eventually you won't need the cheat sheet — it'll just be muscle memory.
Want to go deeper? Once you've got the queries down, check out Detection Engineering 101 to understand how to turn these into real alerts.
How EpicDetect Can Help
Bookmark the free SPL cheatsheet, then run guided queries in the Introduction to SPL pathway.
Want more structure? The EpicDetect Atlas covers SIEM fundamentals and detection challenges.
New here? Sign up and start for free. No credit card required.
Tags
Related Articles

What Is a SIEM? A Beginner’s Guide (With Real Examples)
What is a SIEM, in plain English? How security teams collect, correlate, and alert on logs — with real examples and the platforms you should know.

5 Splunk Mistakes Beginners Make (And How to Fix Them)
New to Splunk? These five common SPL mistakes slow down almost every beginner — here's what to do instead.
SIEM Practice for Beginners: How Analysts Actually Correlate Logs
Querying a SIEM isn't the hard part — knowing what to correlate is. Here's how analysts actually think through log correlation, plus where to practice it.
KQL Cheat Sheet: Essential Microsoft Sentinel Queries for SOC Analysts
A practical KQL cheat sheet for Microsoft Sentinel and Defender. 11 essential Kusto queries every SOC analyst should bookmark.